Python
Fundamental Packages
- pip
- Pip stands for Pip Installs Packages.
- numpy
- one of the common libraries used to set a data.
- matplotlib
- one of the most common libraries used to draw a graph.
- pandas
- Idk
Install Numpy
Numpy stands for Numerical Python. It is a fundamental package for scientific computing in Python.
pip install numpyInstall Matplotlib
Matplotlib is used to create a graph within Python.
pip install matplotlibInstall Pandas
idk
pip install pandasUpdate the pip version
To update the pip version, type the following command.python.exe -m pip install --upgrade pipCreate a 2D Graph
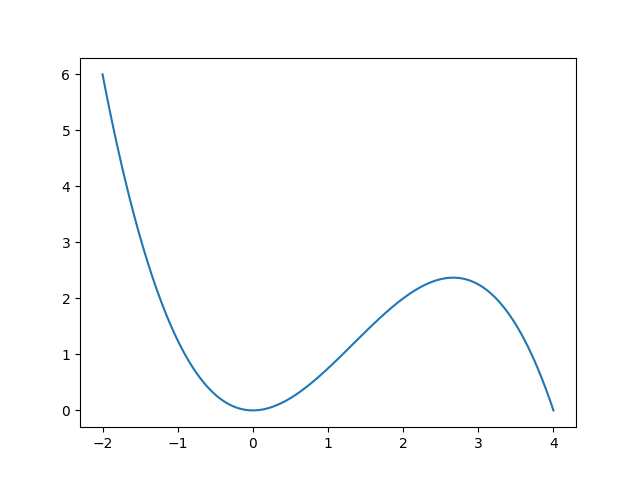
Fundamental Script
The following script enables you to draw a simple graph, as shown below. The graph represents the function \( f(x) = x^2 - \frac{1}{4}x^3 \) , consisting of 400 points, with the x-values ranging from -2 to 4.import matplotlib.pyplot as plt
import numpy as np
x = np.linspace(-2, 4, 400)
y = x**2 - (1/4)*x**3
plt.plot(x, y)
plt.show()
Load plot data from a file
import matplotlib.pyplot as plt
import numpy as np
import pandas as pd

data = pd.read_csv('data.csv')

x = data['my-x']
y = data['my-y']

plt.plot(x, y)
plt.show()
my-x,my-y
-10,10
-6,8
-2,10
2,6
6,10
10,4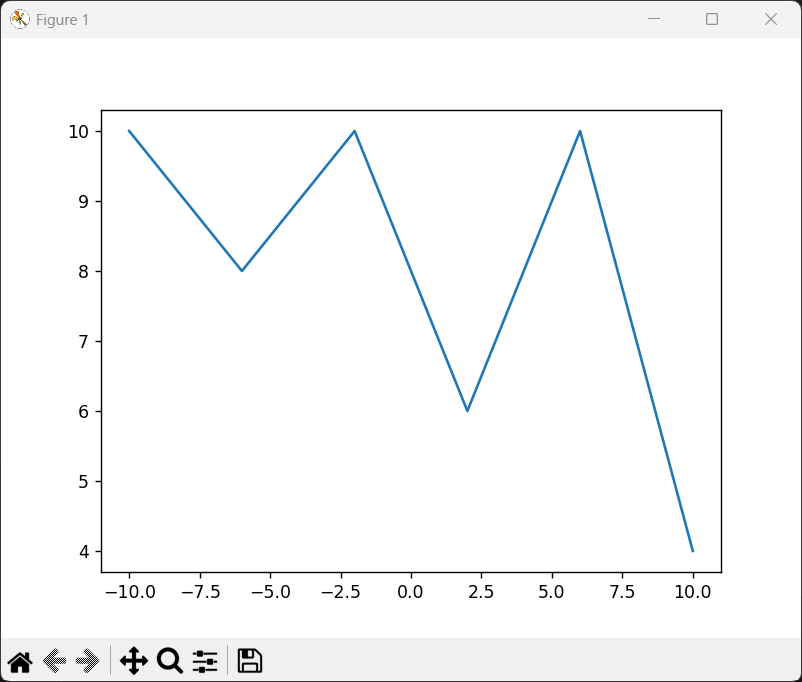
Points and lines
import matplotlib.pyplot as plt
import numpy as np

x = np.linspace(-2, 4, 10)
y = x**2 - (1/4)*x**3

plt.plot(x, y, marker='o', linestyle='-')
plt.show()
- maker
'None', '^', 'x', 'o', 's', etc
- makersize
As default, the markersize is 6.
- linestyle
'None', '-' for solid, ':' for dotted, '--' for dashed
- linewidth
As default, linewidth is 1. it can be smaller than 1, such as 0.5.
- color
'r' for red, 'b' for blue, 'g' for green, 'm' for magenta, 'c' for cyan
plt.plot(x, y, marker='^', markersize=12, linestyle=':', linewidth=2, color='m')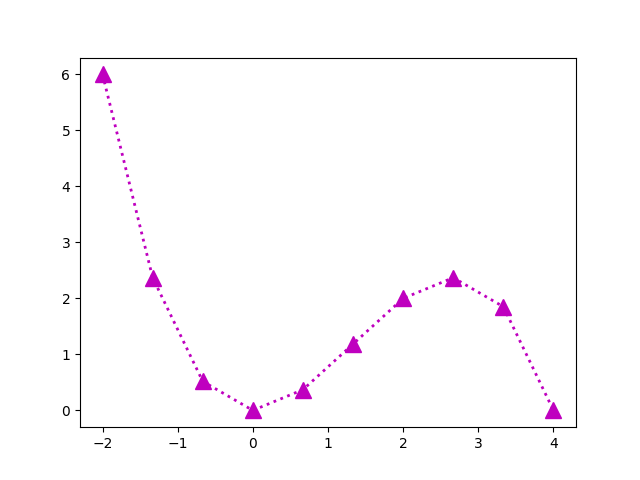
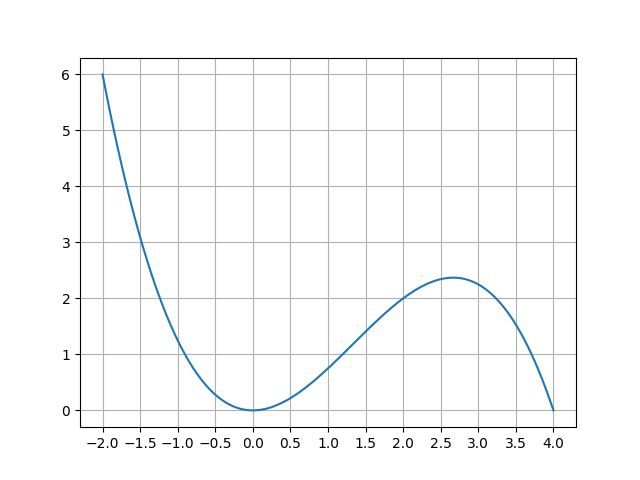
Grid
By addingplt.grid(), you can show grid as shown below.
import matplotlib.pyplot as plt
import numpy as np

x = np.linspace(-2, 4, 400)
y = x**2 - (1/4)*x**3

plt.plot(x, y)
plt.grid()
plt.show()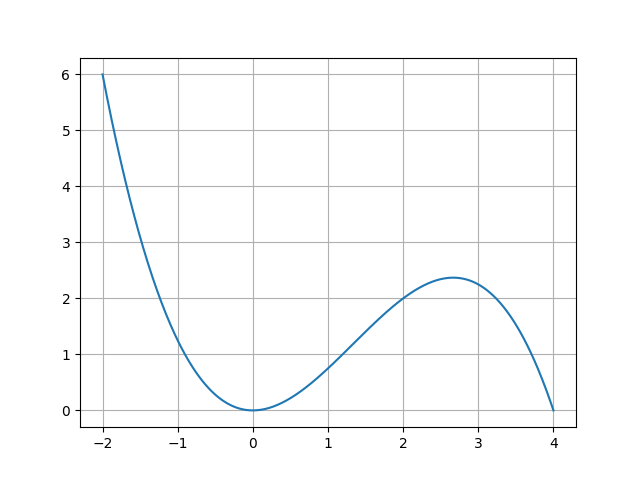
plt.xtics(np.arrange(start, end, step)), you can adjust grid's interval.
import matplotlib.pyplot as plt
import numpy as np

x = np.linspace(-2, 4, 400)
y = x**2 - (1/4)*x**3

plt.plot(x, y)
plt.grid()
plt.xticks(np.arange(-2, 4.5, 0.5))
plt.show()